Credit: Special Arrangement
In response to the flooding caused by the rains a few months back, two IT professionals have created a map depicting the waterflow of the city’s drains.
Though the idea had been brewing for a few months, it was the recent conversations on what caused flooding in Bengaluru, that pushed Aman Bhargava and Vivek Matthew to create ‘Blr Water Log’ and post about it on their blog diagramchasing.fun. Bhargava works as a data visualisation developer. Matthew is a software engineer and also contributes to the Open Street Maps community in Bengaluru.
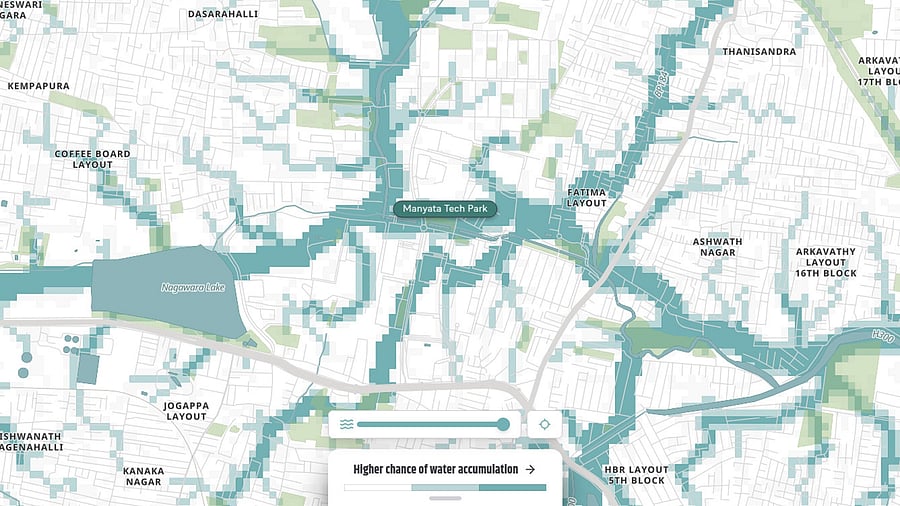
What does the map do? “It depicts how Bengaluru’s terrain causes water to flow and collect in different places. It depicts flow accumulation and whether the flow is upstream or downstream,” says Bhargava.
Matthew adds that different shades of blue depict areas where water is likely to accumulate. The darker shades depict areas that experience maximum flooding such as Ejipura, Koramangala and Manyata Tech Park.
Digital elevation models are used to create such maps and the duo have used an open source initiative called Copernicus, which provides a 30 meter resolution. The map was set up over the course of three weeks.
“It includes collated news articles connected to areas where flooding is a common occurrence. This can be accessed by clicking on the location,” he says.
Last week, a post about the map on X got over 1 lakh views and 1,000 likes. “The purpose of the map is to create interest in understanding the demographic of your city and its storm water drains. Though the information isn’t new, we have tried to keep the map as simple as possible, while making it informative,” Bhargava says.
Currently, one can locate their current location, check multiple neighbourhoods and read a few news articles written about the respective localities. “If there are important news articles or incidents of flooding that we missed, they will be updated accordingly. We have added a feature through which viewers can also contribute,” adds Matthew.
Many netizens asked if such a map could be created for cities like Mumbai and Chennai. Bhargava says: “All of our projects are open source and reproducible, and people can reproduce the map according to their own demographic.”
Visit diagramchasing.fun/2024/blr-water-log