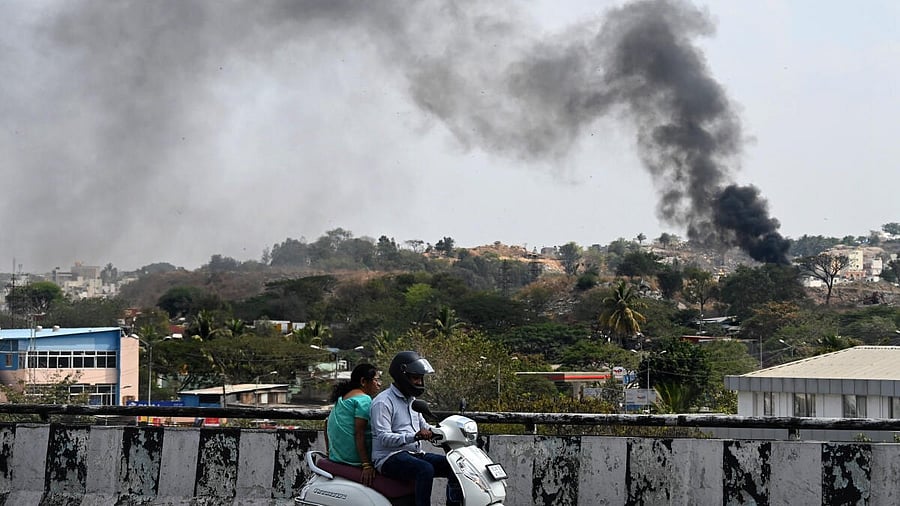
Thick black smoke fills the air due to burning of unknown objects near Nayandahalli in Bengaluru. (Representative image)
Credit: DH File Photo/Pushkar V
New Delhi: Before the turn of the new millennium, toxic air would have cut the life-expectancy of every Bengalurean by eight months. Twenty five years later, it has risen to a loss of over two years of lives for each resident of the Garden City, according to new air pollution data.
In the same time span, every Karnataka district witnessed doubling of PM-2.5 level in air, though the concentrations of these tiny toxic particles in the state were not as high as the most polluted northern plains, shows the latest district wise air quality data accessed by DH.
The new set of air pollution statistics is from University of Chicago’s Air Quality Life Index that looks at the air quality across the world using satellite data.
The researchers focussed on dangerous PM-2.5 or particulate matter of 2.5 micron size that penetrates the lungs and travels to the bloodstream, triggering multiple health disorders.
In some of the years, the situation was worse in Bengaluru. For instance, improving the air quality to the WHO safe limit of 5 micrograms per year would have added an additional 2.9 years for each Bangalorean in 2016.
It would have been 2.6 years in 2018 and 2.5 years each in 2019 and 2021. Since 2007, the figure has never dropped below two years.
“Our annual reports do not estimate the number of years of life already lost. Instead, they estimate the number of years that could be lost on average if people were exposed to the pollution levels of a given year over the long term,” said Tanushree Ganguly, director, Air Quality Life Index.
“By design, the AQLI tool cannot explain why we are seeing the trends, but what it does is help people identify where impacts of pollution are worsening over time,” she told DH.
Way back in 1998 before the IT boom, Bengaluru had a PM-2.5 level of 13.1 microgram per cubic meter, but it increased to 26.21 microgram in 2023. Similar rise has been seen in many other districts including Kalaburgi (26.31), Bidar (25.01) and Belgaum (23.72).
In 2019, India launched its National Clean Air Programme (NCAP) that has been extended to 131 cities. The revised target is 40% reduction in particulate pollution - as compared to the 2017 level - by 2026.
"As of 2023, pollution in the districts with non-attainment cities had declined by 10.5% relative to 2017 (base year for the NCAP) adding six months to the life expectancy of 443.4 million residents, and two months to India’s national average life expectancy," the University of Chicago says in a report.
If the ambition of the revised target is met, these cities’ overall annual average PM-2.5 exposure would be 21.9 microgram per cubic meter lower than 2017 levels, adding 2.1 years onto the life of the average Indian living in these cities, and 7.9 months to the national average life expectancy.
