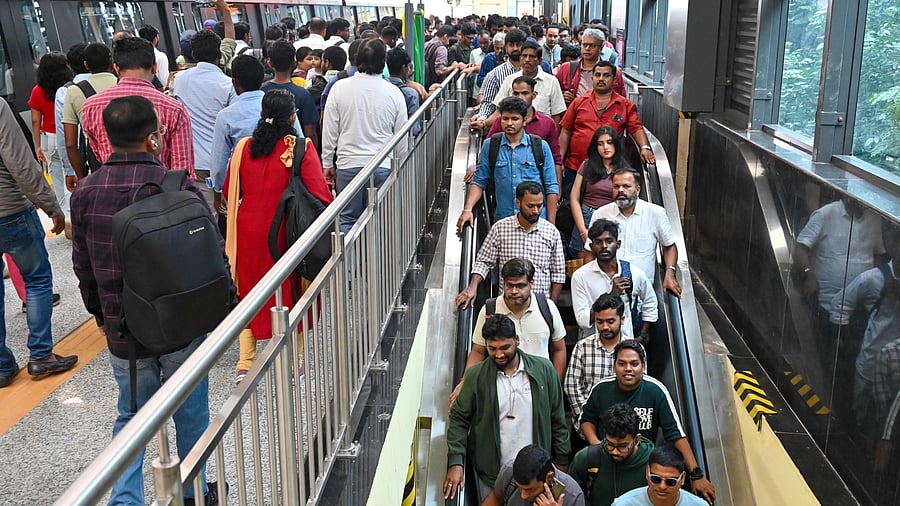
Bengaluru: Bangalore Metro Rail Corporation Limited (BMRCL) has countered concerns over its recent fare hike, maintaining that it was set through a statutory, independent process.
On Saturday, it gave a point-by-point response to concerns raised by mobility expert Satya Arikutharam in a DH article (Sept 27).
105.15% is not fare hike: 105.15% is not the fare hike but a percentage of increase that BMRCL calculated based on the movement in a composite cost index that tracks changes in key inputs since the 2017 revision. The index combines staff, energy, repair and maintenance costs. The Fare Fixation Committee (FFC) considers this index but does not mechanically adopt it. The actual hike averaged 51.55% before discounts and 46.39% after Sunday, holiday and off-peak discounts. The 105.15% is a basketed index, and comparing it directly with one component, like 39.6% rise in O&M cost, assumes they are the same metric. They are not.
Depreciation claim: The criticism that 66% of the hike was to fund depreciation is incorrect. The fare-revision methodology considers three cost heads only: staff, energy, and repair and maintenance. The formula adopted by the company indirectly also accounts for financing costs such as interest on loans and a limited provision for lifecycle renewals. This is not accounting “book depreciation” to recover past capital expenditure. Rather, it is a pragmatic provision to keep trains, track, power and signalling safe and reliable as assets age.
Renewal provisioning is a standard practice in metros worldwide. Without it, a system cannibalises itself, safety declines and commuters ultimately suffer. A composite index avoids cherry-picking single-year spikes or dips, giving a consistent and auditable basis for discussion.
Like-for-like calculations: Another allegation is that BMRCL divided 2016-17 costs, when 30.3 km was operational, by the 2017-18 network length of 42.3 km, thereby understating the base cost per kilometer. This is simply wrong. Each year’s costs are divided by the operational length of that same year: 2016-17 costs by 30.3 km, 2017-18 by 42.3 km, and so on. The fact that the 2017 fare structure applied to the full Phase 1 network of 42.30 km does not alter this method.
Moderation and recalibration: Due to a reduction in fare zones from 29 to 10, some slabs initially saw sharper hikes. BMRCL capped the maximum increase at 71.43% and reworked over 600 fare combinations to smooth outcomes while retaining the FFC’s averages.
Energy costs — 25.38% vs 33.72%: Why BMRCL shows a 33.72% increase while audited accounts show 25.38%? The answer lies in the basis of measurement. The 33.72% is based on the actual expenditure incurred per unit of electricity consumed in the year, including base tariff, surcharges such as FAC/PPAC, minimum demand charges and electricity duty. By contrast, the 25.38% is computed as energy cost per route kilometre, which uses a different denominator and is not a like-for-like comparison. In short, energy cost per km and energy cost per unit are different bases and should not be directly compared.
Comparisons across metros: Direct comparisons can be misleading. Fare structures differ by distance bands, service levels and operating costs. For context, Indore Metro has a fare of Rs 80 for over 18 km and a minimum of Rs 20 for 1-2 km. For DMRC, GoI provides the cost of security guards while BMRCL has to bear all the components of expenses.
Choice of formula: The use of a composite index formula is not unique to Bengaluru. It has its origins in the Delhi Metro’s experience, where the board and the 4th FFC agreed that CPI alone does not capture the full rise in O&M costs. Metro cost structures differ fundamentally from household consumption: they are driven by wages, electricity and asset renewals. The formula, therefore, gives a more representative and auditable picture.
Construction delays: Delays in infrastructure projects are common due to land acquisition, utility shifting, tree-cutting permissions. While they affect the timing of revenues, they do not alter how fares are calculated.
Foreign loans and hedging: BMRCL’s borrowings are raised under sovereign and state support, with terms cleared by the government of India and multilateral agencies. Hedging strategies are applied in line with Ministry of Finance norms and are a separate subject altogether. For fare revision, what matters is the actual loan-servicing cash outflow, which is transparently reflected in the cost data.
Cost audits: There is no statutory requirement for a cost audit under the Companies Act for BMRCL. However, all accounts are audited annually by the C&AG and published.
Non-fare revenue: BMRCL has been an early mover in non-fare revenue streams such as advertising rights, station naming rights, property development, kiosks and retail. These are growing steadily. That said, worldwide experience shows that fare box revenue must remain the backbone of metro sustainability; non-fare sources supplement but cannot fully replace it.